Microsoft ProcDump tool lets you generate crash dump files to troubleshoot problems with apps, and here's how to use the command-line tool on Windows 10.
On Windows 10, ProcDump is a command-line tool specifically designed to create crash dump files manually. A "dump" is a special file that contains (all or parts) of the data loaded in memory at the time dump was triggered. Usually, you would use this file for analysis to determine the root of a problem with an app or the OS.
Although Windows 10 can create crash dumps files automatically when it encounters an error that it cannot handle, sometimes you may still need to generate these files manually. For example, if you are a developer and you are testing a new application. Or when an app is not responding or constantly crashing, and you need to send the details to the software vendor support to investigate the issue.
Whatever the reason might be, the Microsoft ProcDump tool is a nifty tool you can use in Command Prompt to create a crash dump file in many different ways, including generating a minidump file using the app or process name or process ID. You can also use the tool to create multiple dumps at different intervals automatically. Or you can specify other criteria, such as when the process reaches a specific processor usage, the app is unresponsive, and more.
In this Windows 10 guide, we will walk you through the steps to use the Microsoft ProcDump tool to generate dump files manually on your device.
How to install ProcDump on Windows 10
To install the ProcDump command-line tool on Windows 10, use these steps:
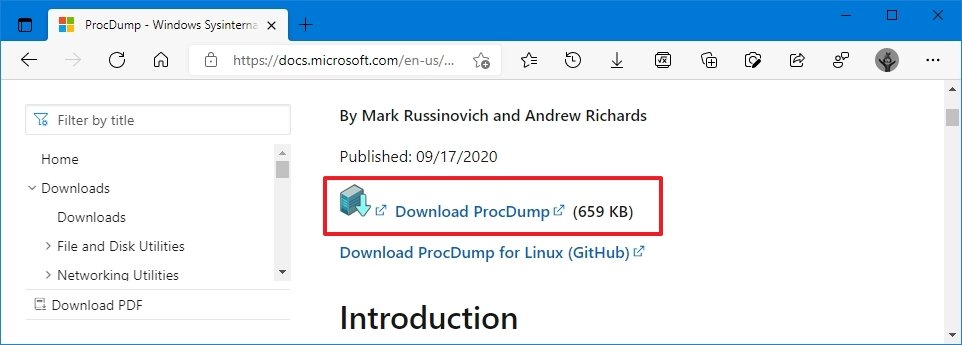
- Open ProcDump official page.
-
Click the Download ProcDump link.
- Save the file on the device.
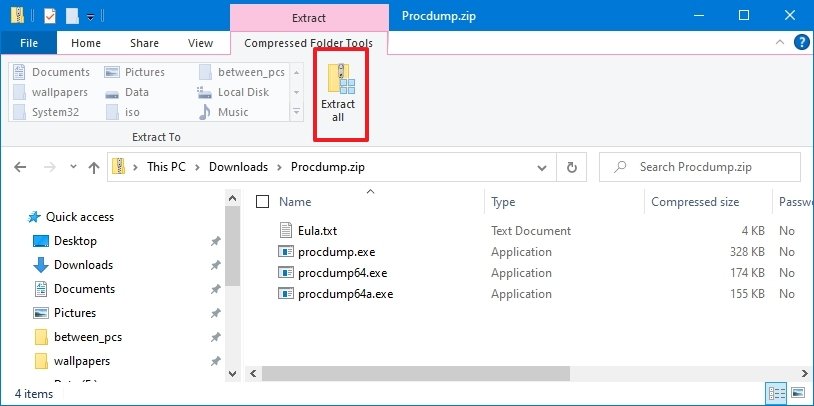
- Open the zip folder.
-
Click the Extract all option from the "Compressed Folder Tools" tab.
-
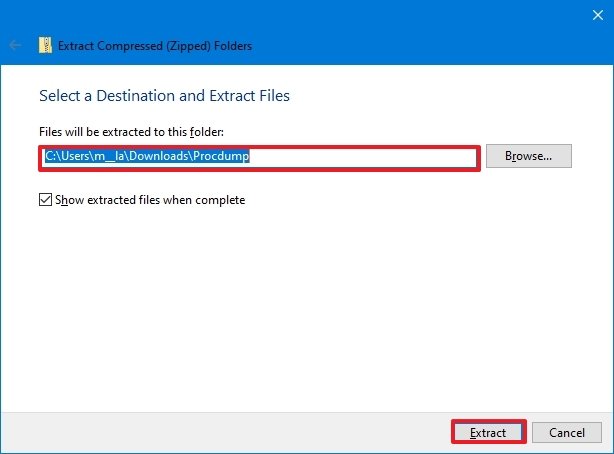
Confirm a path to extract the files.
- Check the Show extracted files when complete option.
- Click the Extract button.
Once you complete the steps, you can use ProcDump with Command Prompt to create dumps files on Windows 10.
How to use ProcDump on Windows 10
The ProcDump tool includes many options to record and create dump files. In the steps below, we will show you a bunch of examples to create a dump file for a specific application and different scenarios, including when a process is unresponsive, crashes, uses a significant amount of processor resources, and more.
To get started with the ProcDump tool, use these steps:
- Open Start.
- Search for Command Prompt, right-click the top result, and select the Run as administrator option.
-
Type the following command to navigate to the folder containing the ProcDump tool and press Enter:
cd C:\PATH\TO\PROCDUMPIn the command, make sure to update the path with the folder's location with the ProcDump tool.
For example, this command opens the tool location inside the "Downloads" folder:
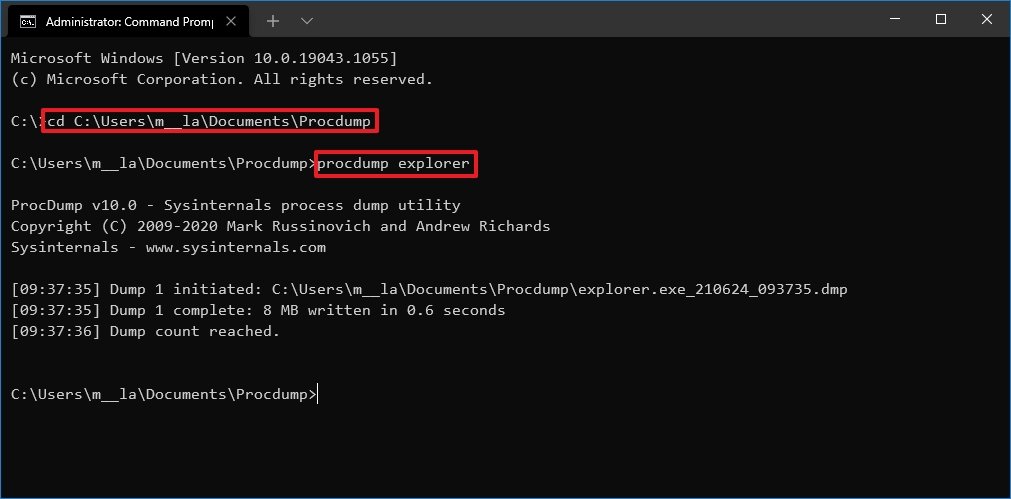
cd C:\Users\username\Documents\Procdump -
Type the following command to create a minidump file of a running app and press Enter:
procdump APP-NAMEIn the command, replace APP-NAME for the executable name of the app.
This example creates a dump file for the File Explorer app:
procdump explorer -
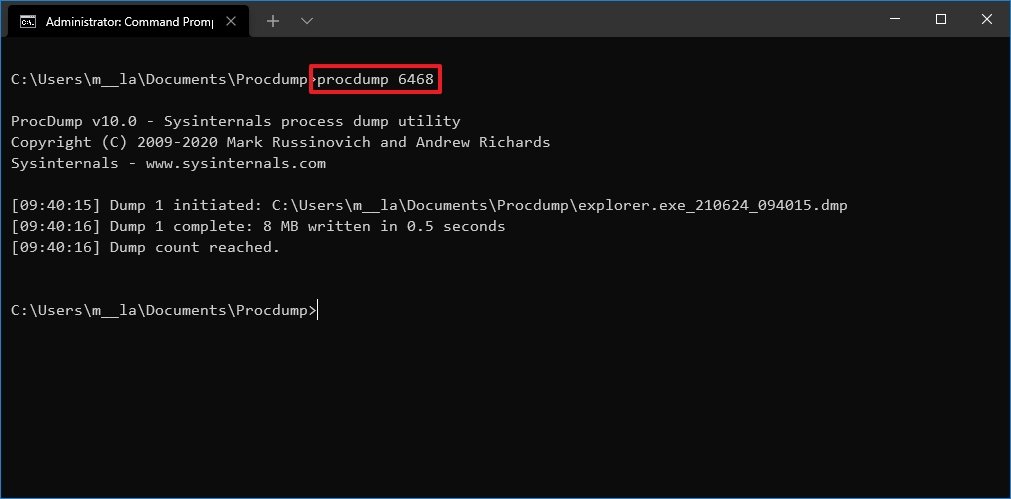
Type the following command to create a dump file using the process ID of the app and press Enter:
procdump PROCESS-IDIn the command, replace PROCESS-ID with the actual ID of the process or application.
This example creates a dump file for File Explorer with the process ID of 6468:
procdump 6468Quick tip: You can always confirm the process ID (PID) of an app in the Details tab of Task Manager or using the
tasklistcommand. -
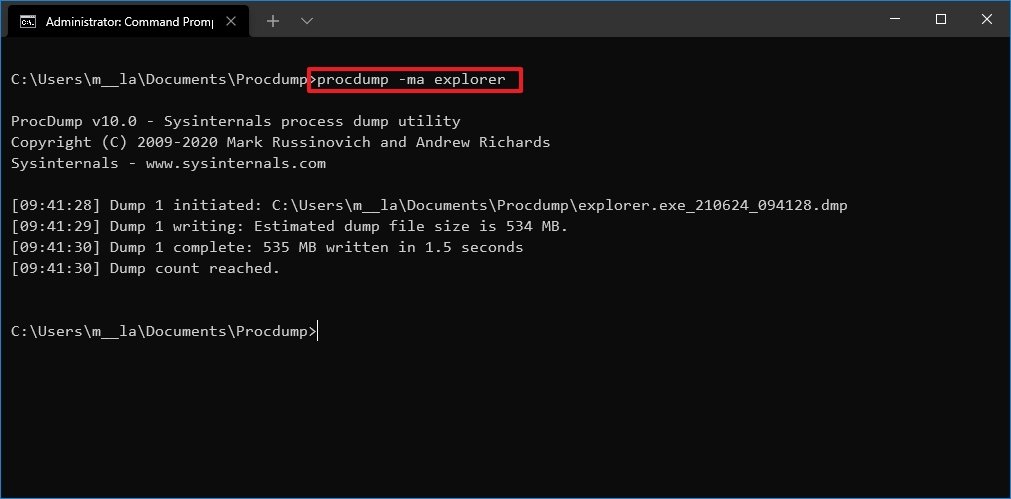
Type the following command to create a full dump file for an application and press Enter:
procdump -ma APP-OR-PIDIn the command, replace APP-OR-PID for the name or process ID of the app.
This example creates a full dump file for File Explorer:
procdump -ma explorerQuick note: A full dump file contains everything available in memory related to the application. In contrast, a minidump file is only several megabytes in size, and it includes basic information about the application.
- Confirm the location of the .dmp file.
After you complete the steps, the dump file will be generated in the ProcDump folder.
Create multiple minidumps manually
To use ProcDump to create multiple minidump files on Windows 10, use these steps:
- Open Start.
- Search for Command Prompt, right-click the top result, and select the Run as administrator option.
-
Type the following command to navigate to the folder containing the ProcDump tool and press Enter:
cd C:\Users\username\Documents\Procdump -
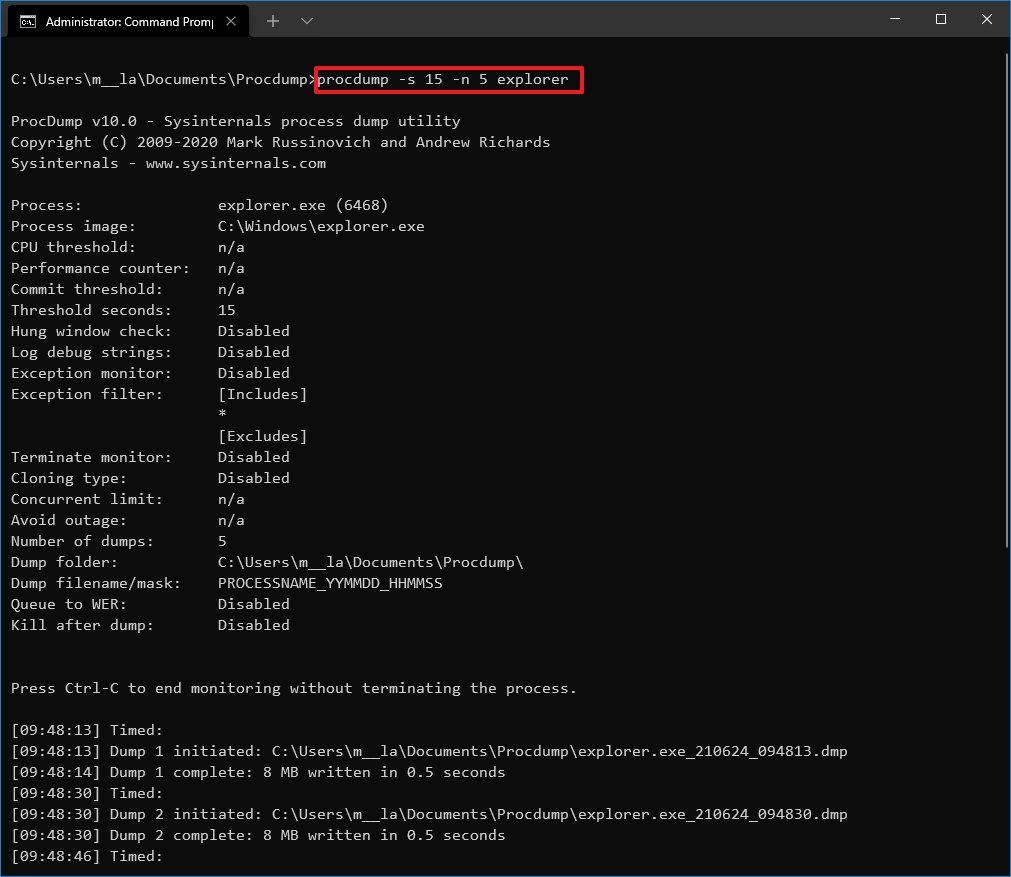
Type the following command to write five minidumps 15 seconds apart from one another and press Enter:
procdump -s 15 -n 5 PROCESS-NAMEIn the command, replace the PROCESS-NAME for the name of the process you want to write a dump. Also, remember to update the 15 for the number of seconds to wait before generating a new file and 5 for the number of dump files you want to create.
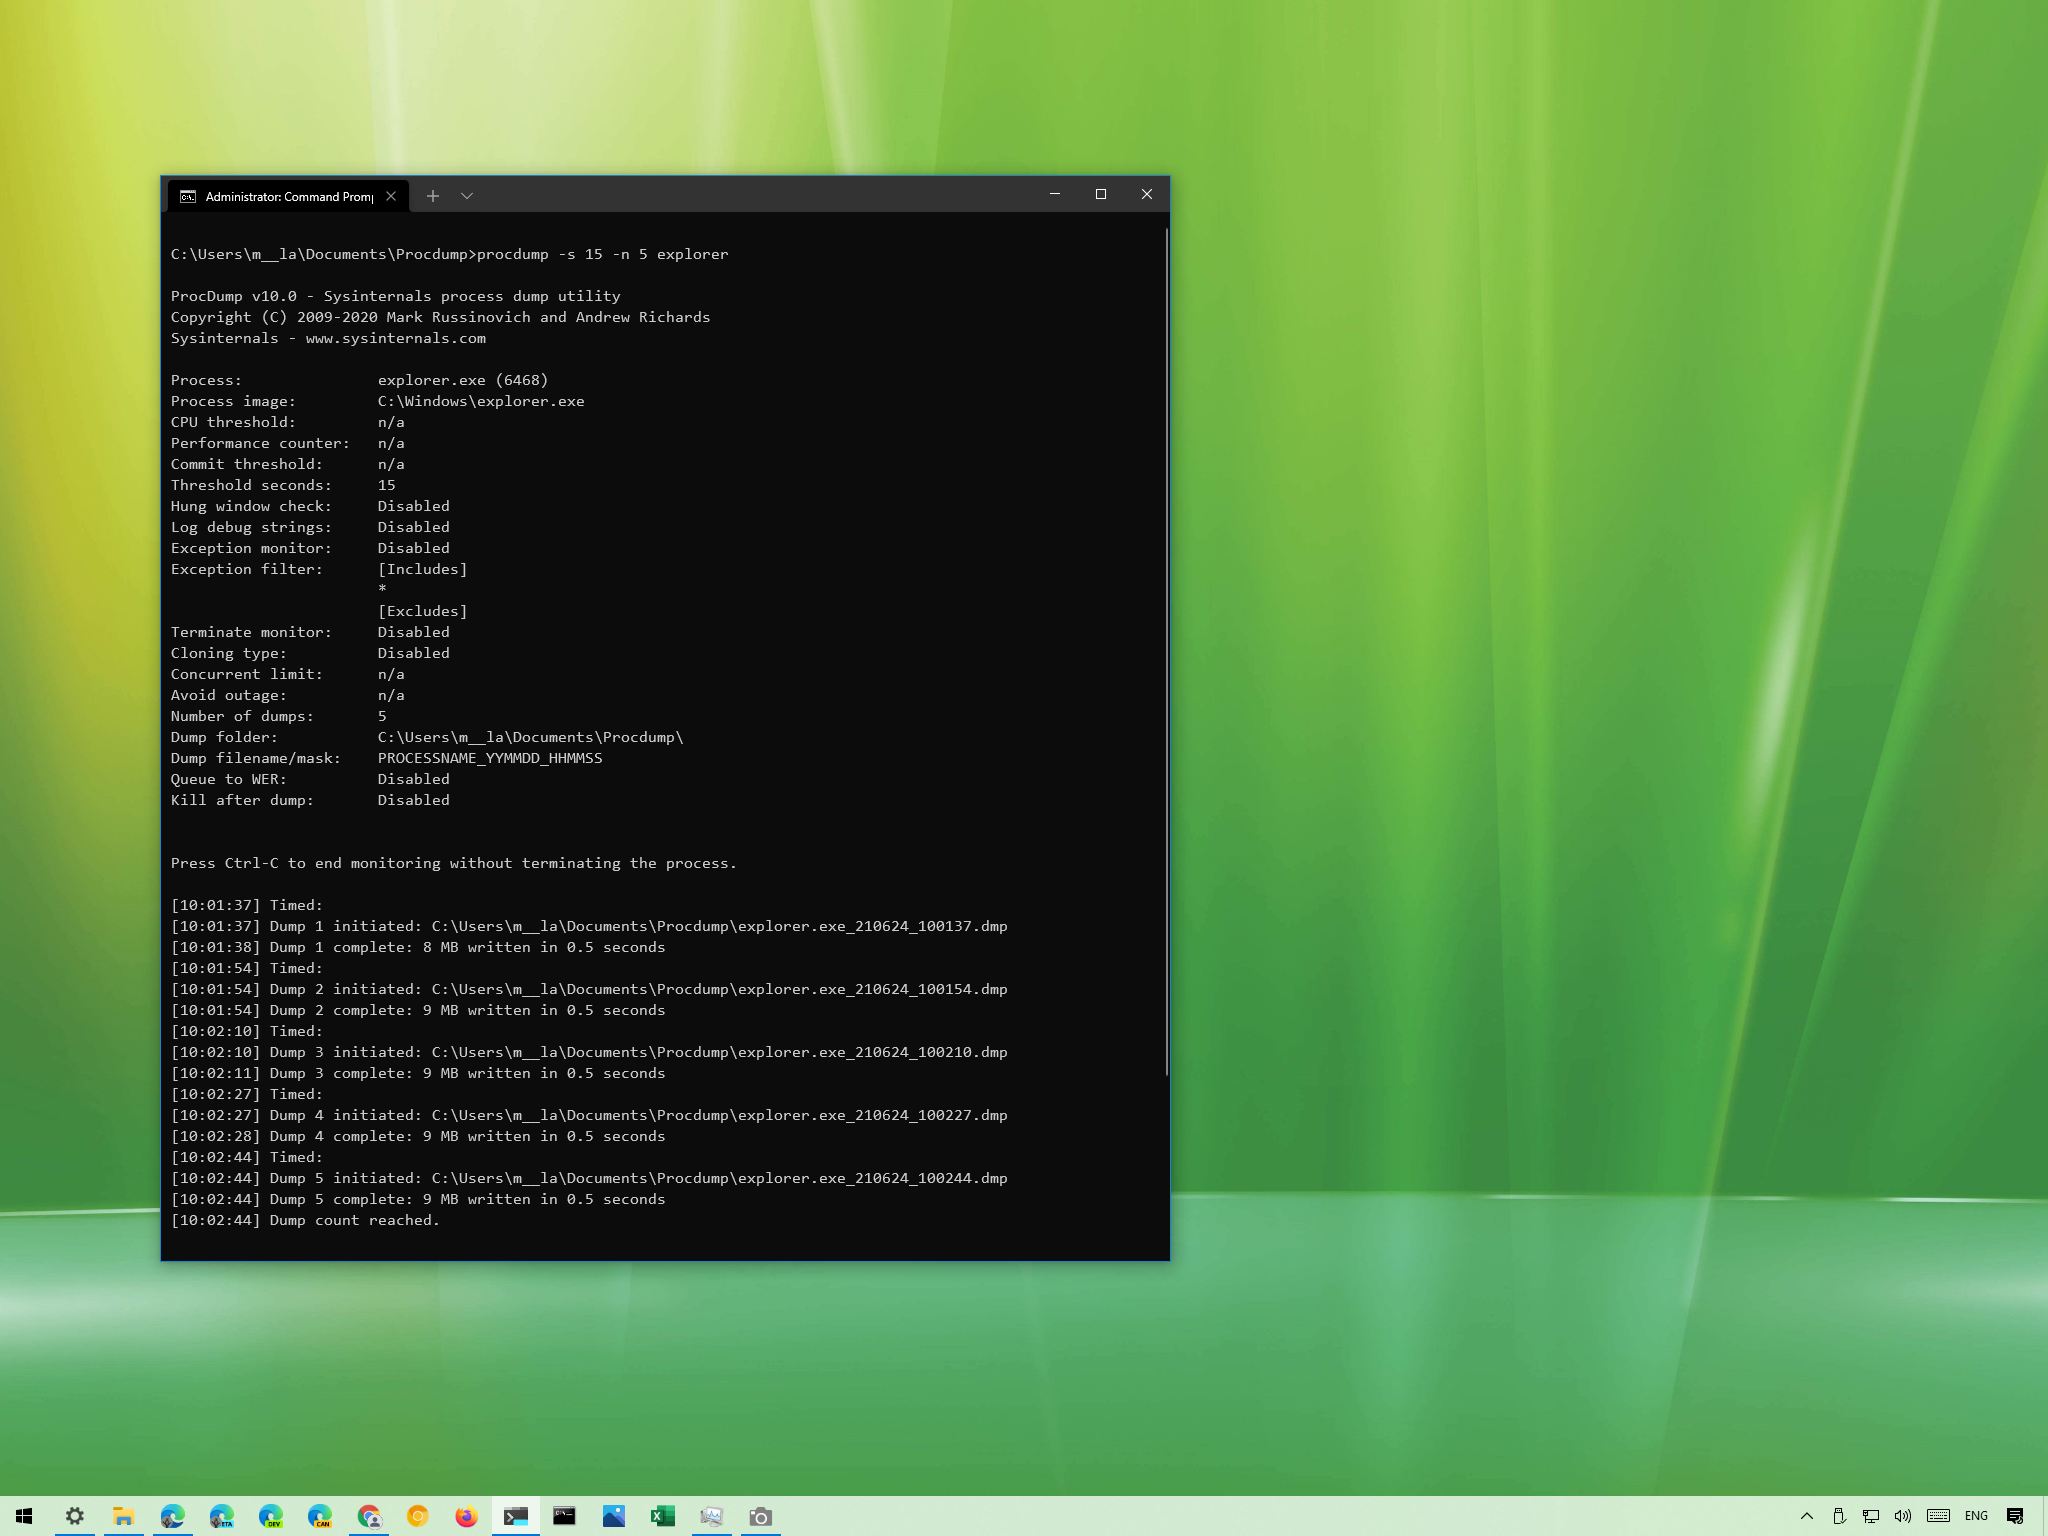
This example writes five dump files for the Windows Explorer process:
procdump -s 15 -n 5 explorer
Once you complete the steps, the tool will create (in this case) five dump files 15 seconds apart from one another.
Create minidumps based on processor usage
To write a dump file after the app system usage reaches a specific threshold, use these steps:
- Open Start.
- Search for Command Prompt, right-click the top result, and select the Run as administrator option.
-
Type the following command to navigate to the folder containing the ProcDump tool and press Enter:
cd C:\Users\username\Documents\Procdump -
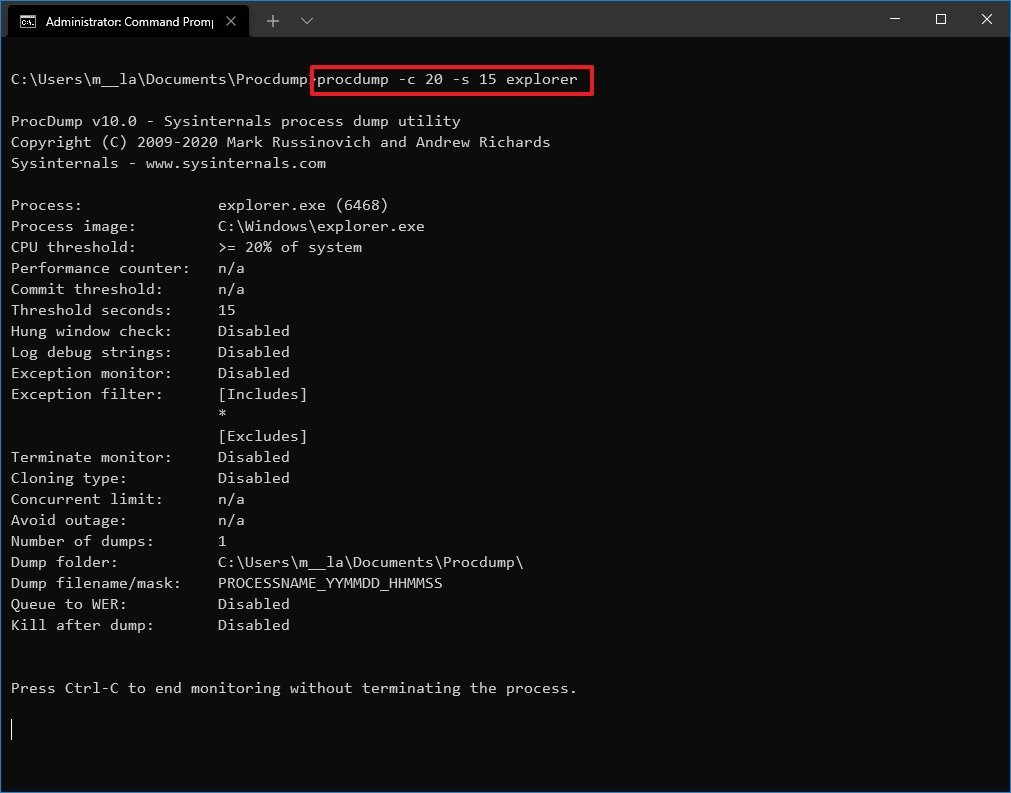
Type the following command to write a minidump file when the process exceeds the 20% processor usage for 15 seconds and press Enter:
procdump -c 20 -s 15 PROCESS-NAMEIn the command, replace the PROCESS-NAME for the name of the process you want to write a dump. Also, remember to replace 20 and 15 for processor usage and a wait time in seconds.
This example writes a dump file of the explorer.exe process that uses over 20% of processor resources for 15 seconds:
procdump -c 20 -s 15 explorer -
(Optional) Type the following command to write an error dump file when a specific app pushes processor usage above 20% for 10 seconds and press Enter:
procdump PROCESS-NAME -p "\Processor(_Total)\% Processor Time" 20This example writes a dump file of the explorer.exe process that uses over 20% of processor resources for 10 seconds:
procdump explorer -p "\Processor(_Total)\% Processor Time" 20
After you complete the steps, the command will monitor the application, and when it exceeds the processor usage for the time you specified, then a dump file will be generated.
Create minidumps for unresponsive process
To create a minidump as soon as a process is unresponsive, use these steps:
- Open Start.
- Search for Command Prompt, right-click the top result, and select the Run as administrator option.
-
Type the following command to navigate to the folder containing the ProcDump tool and press Enter:
cd C:\Users\username\Documents\Procdump -
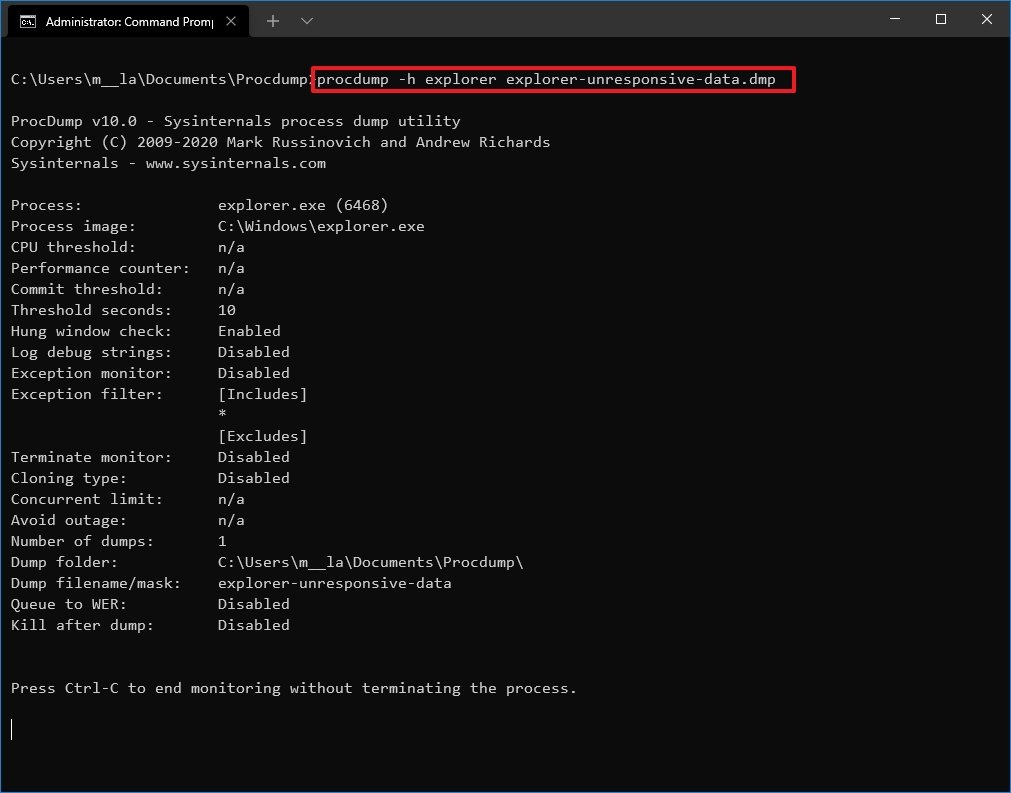
Type the following command to write a minidump file when a process becomes unresponsive for more than five seconds and press Enter:
procdump -h PROCESS-NAME DUMP-NAME.dmpIn the command, replace the PROCESS-NAME for the name of the process you want to monitor and DUMP-NAME for the file's name.
This example writes a dump when the Windows Explorer process becomes unresponsive for five seconds:
procdump -h explorer explorer-unresponsive-data.dmp
Once you complete the steps, a dump file will be written to the ProcDump folder when the application becomes unresponsive.
Create minidump during launch of a process
To launch an app, keep monitoring it, and write a dump file when an exception occurs, use these steps:
- Open Start.
- Search for Command Prompt, right-click the top result, and select the Run as administrator option.
-
Type the following command to navigate to the folder containing the ProcDump tool and press Enter:
cd C:\Users\username\Documents\Procdump -
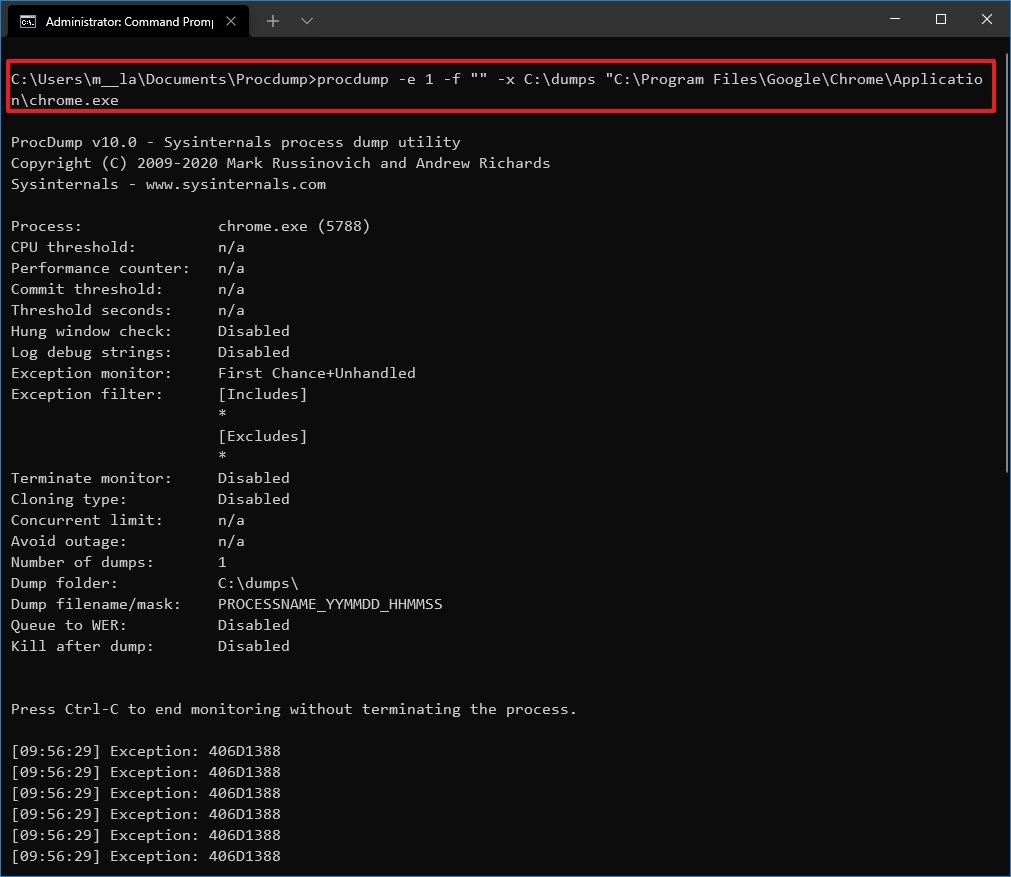
Type the following command to start an app and create a dump file when it crashes, and press Enter:
procdump -e 1 -f "" -x C:\PATH\TO\STORE\DUMP "C:\PATH\TO\APP.EXE"In the command, replace C:\PATH\TO\STORE\DUMP for the folder location to store the dump. Also, change C:\PATH\TO\APP.EXE for the path of the app you want to monitor and create a dump.
This example creates a dump file of Google Chrome when it crashes and stores the "dump" file inside the dumps folder:
procdump -e 1 -f "" -x C:\dumps "C:\Program Files\Google\Chrome\Application\chrome.exe
After you complete the steps, the tool will launch and monitor the app, and when it crashes, it will create a dump file in the folder location you specified.
Activate Postmortem Debugger to create full dump automatically
You can also register the tool as a Postmortem Debugger to allow ProcDump to monitor and automatically write a full dump when one or more processes crash. Here's how:
- Open Start.
- Search for Command Prompt, right-click the top result, and select the Run as administrator option.
-
Type the following command to navigate to the folder containing the ProcDump tool and press Enter:
cd C:\Users\username\Documents\Procdump -
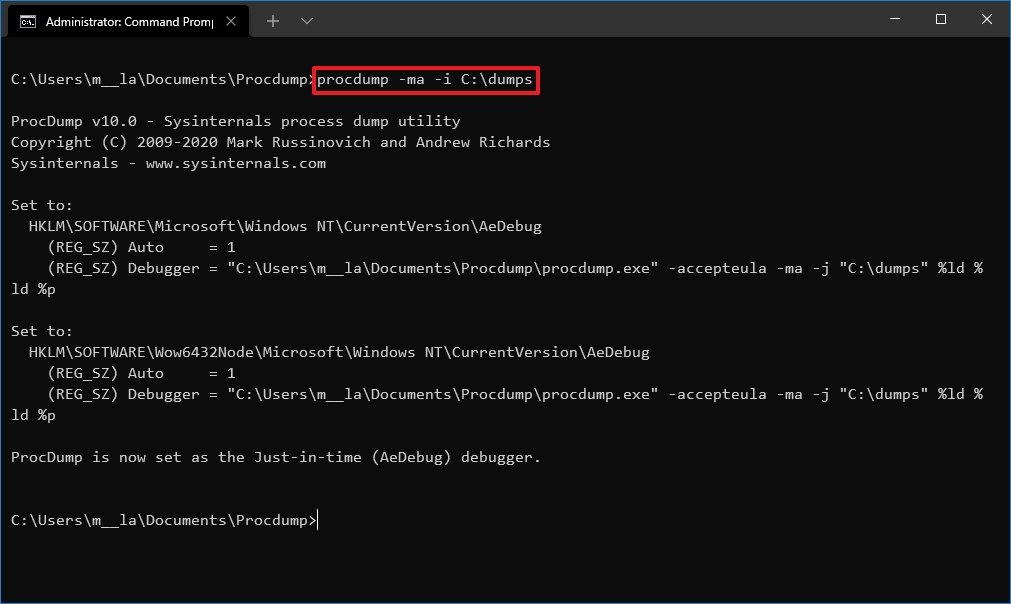
Type the following command to monitor and create a full dump file when one or more processes crash and press Enter:
procdump -ma -i C:\PATH\TO\STORE\DUMPIn the command, replace C:\PATH\TO\STORE\DUMP for the location to store the dump file.
This examples stores the full dump file in the "dumps" folder:
procdump -ma -i C:\dumps
Once you complete the steps, the ProcDump tool will monitor the system, and it will create dump files whenever an application crashes.
We are focusing only on some basic examples. You can always run the procdump -e command to review all the available options.
More Windows 10 resources
For more helpful articles, coverage, and answers to common questions about Windows 10, visit the following resources:



0 comments:
Post a Comment