If your PC keeps crashing, the dump file may contain hints on how to solve the problem, and in this guide, we'll show you the steps to review the file on Windows 10.
On Windows 10, every time there is a crash, the system creates a "dump" file containing the memory information at the time of the error that can help determine the reason of the problem.
The ".dmp" file includes the stop error message, list of the drivers loaded at the time of the problem, and kernel, processor, and processes details, as well as other pieces of information depending on the type of dump file you are using.
Although Windows 10 creates dump files automatically, the only problem is that you won't find any built-in tools to open them, and this is when the Microsoft WinDbg tool comes in handy. WinDbg (Windows Debugging) is a tool that has been designed for debugging kernel-mode and user-mode code, examining processor registries, and analyze crash dumps.
In this Windows 10 guide, we will show you the steps to open a dump file to try to figure out what caused the crash to resolve the problem on your computer.
How to open dump file with WinDbg on Windows 10
On Windows 10, you may find multiple ways to open and review a dump error file, but the easiest way is to use the WinDbg tool available through the Microsoft Store.
Install WinDbg
To install the WinDbg tool on Windows 10, use these steps:
- Open your preferred browser.
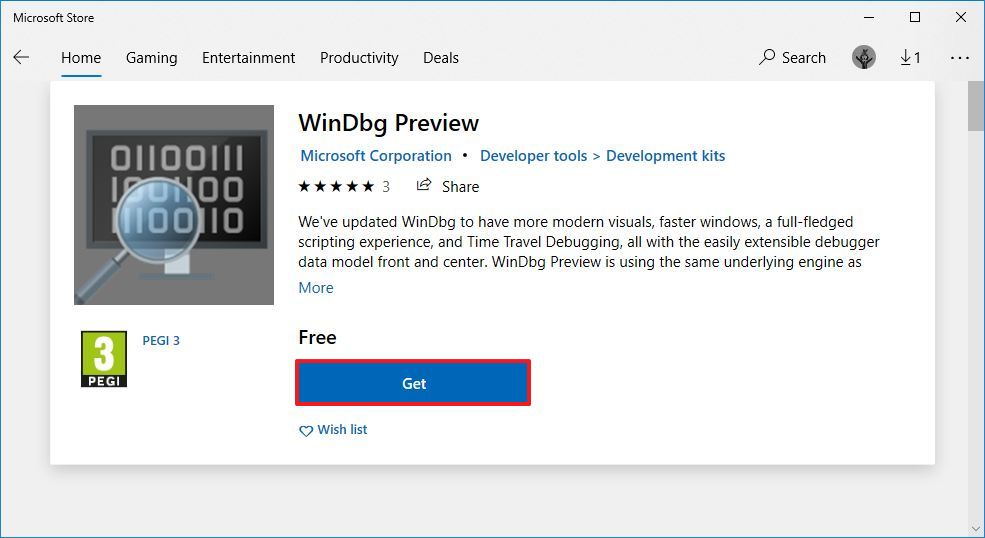
- Open the WinDbg download page.
- Click the Get (or Install/Open) button.
- Click the Open button.
-
Click the Install button.
Once you complete the steps, the application will install, and it will be available through the Start menu.
Analyze dump file
To open and analyze a dump file created by a crash on Windows 10, use these steps:
- Open Start.
-
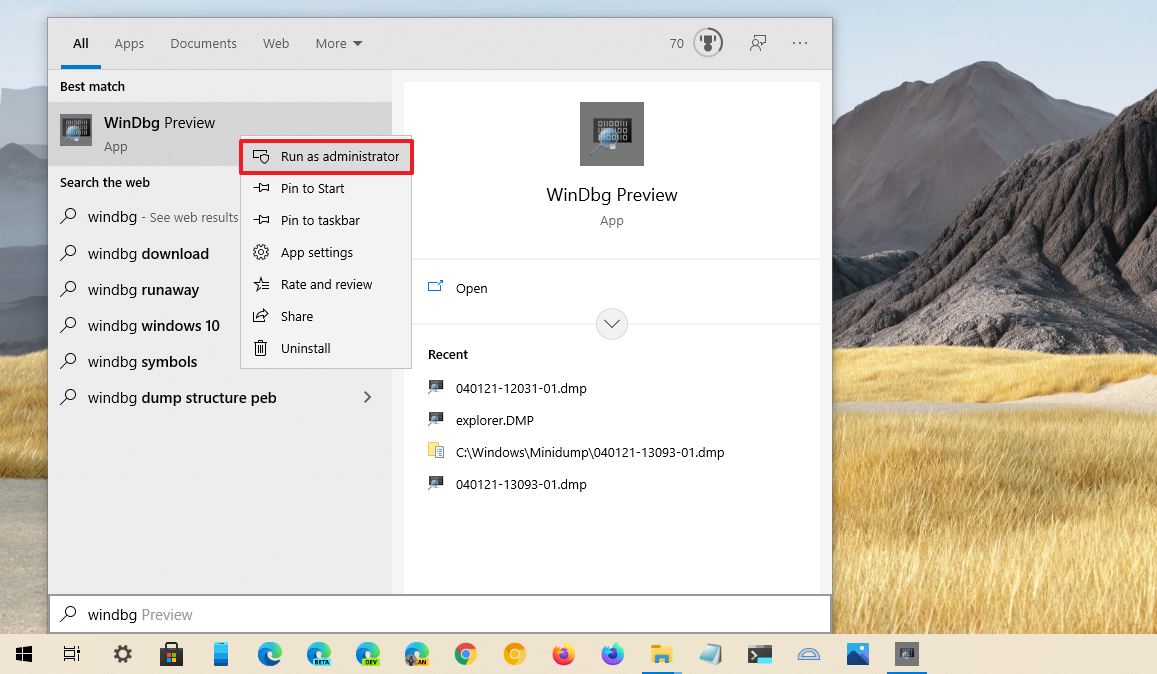
Search for WinDbg, right-click the top result, select the Run as administrator option.
- Click the File menu.
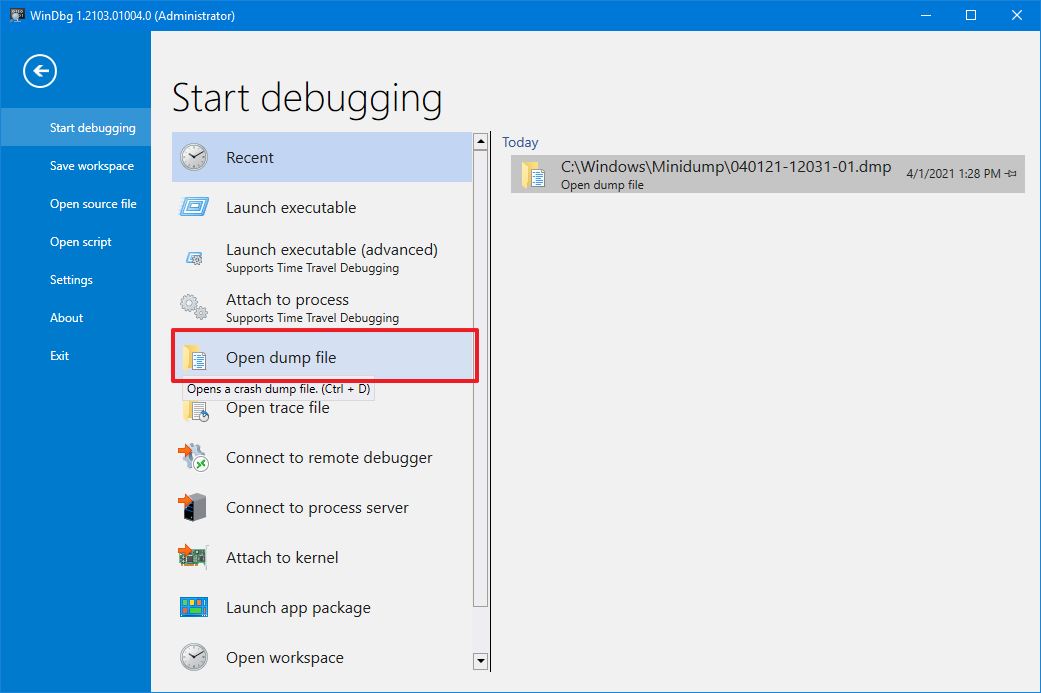
- Click on Start debugging.
-
Select the Open sump file option.
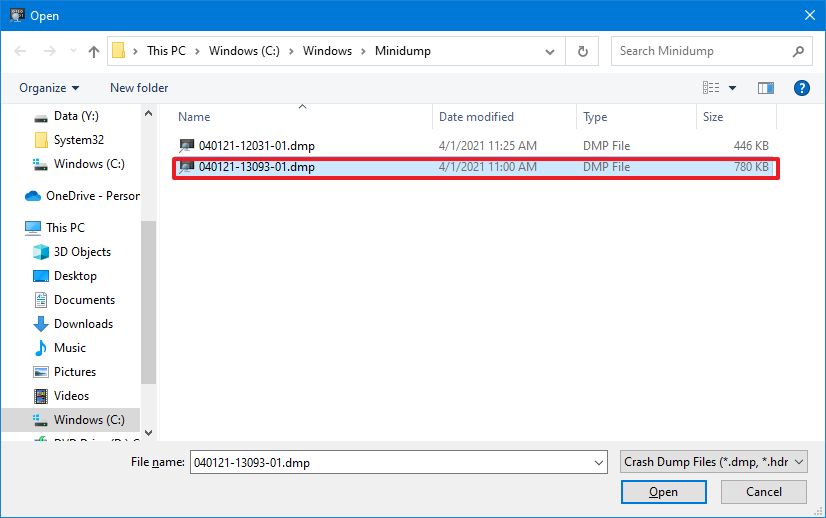
- Select the dump file from the folder location – for example,
%SystemRoot%\Minidump. -
Click the Open button.
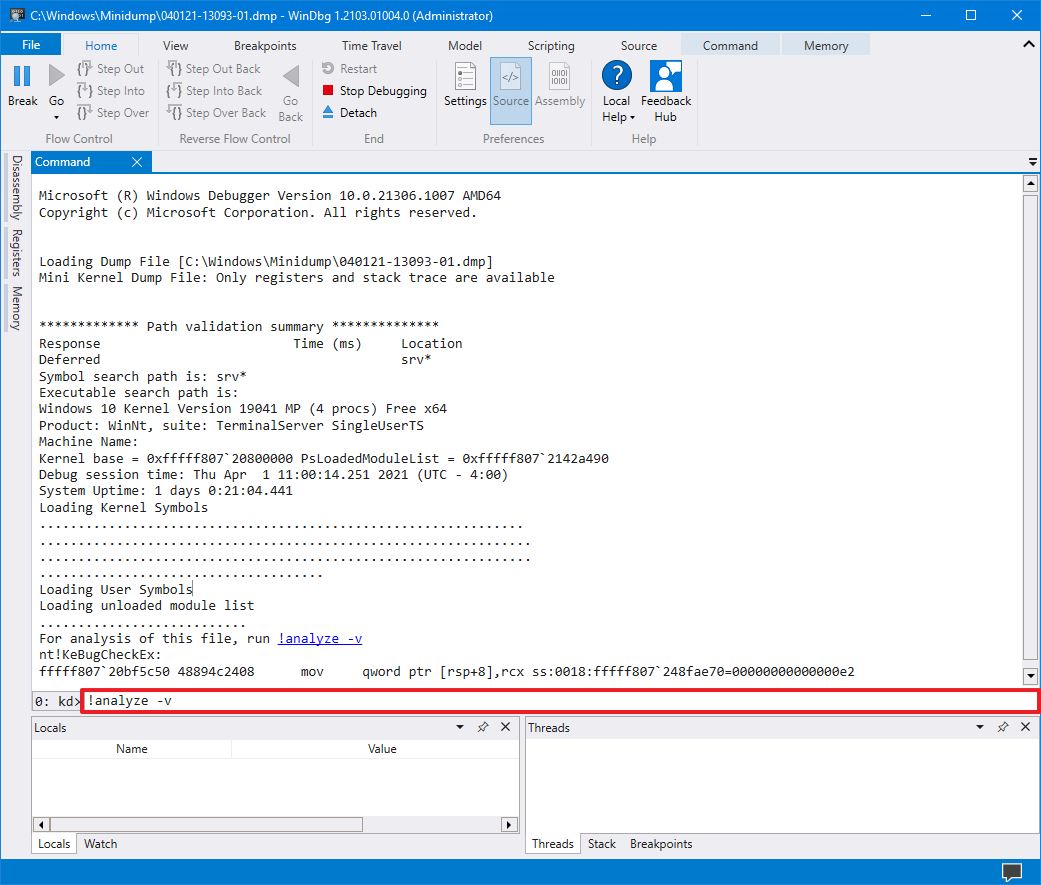
- Check the progress bar until it loads the dump file (this may take a while).
-
Type the following command in the run command and press Enter:
!analyze -vQuick tip: You can also click the !analyze -v link if available from the main area if available after loading the dump file.
- Check the progress bar until the analysis is complete (this may take a long time depending on the data size).
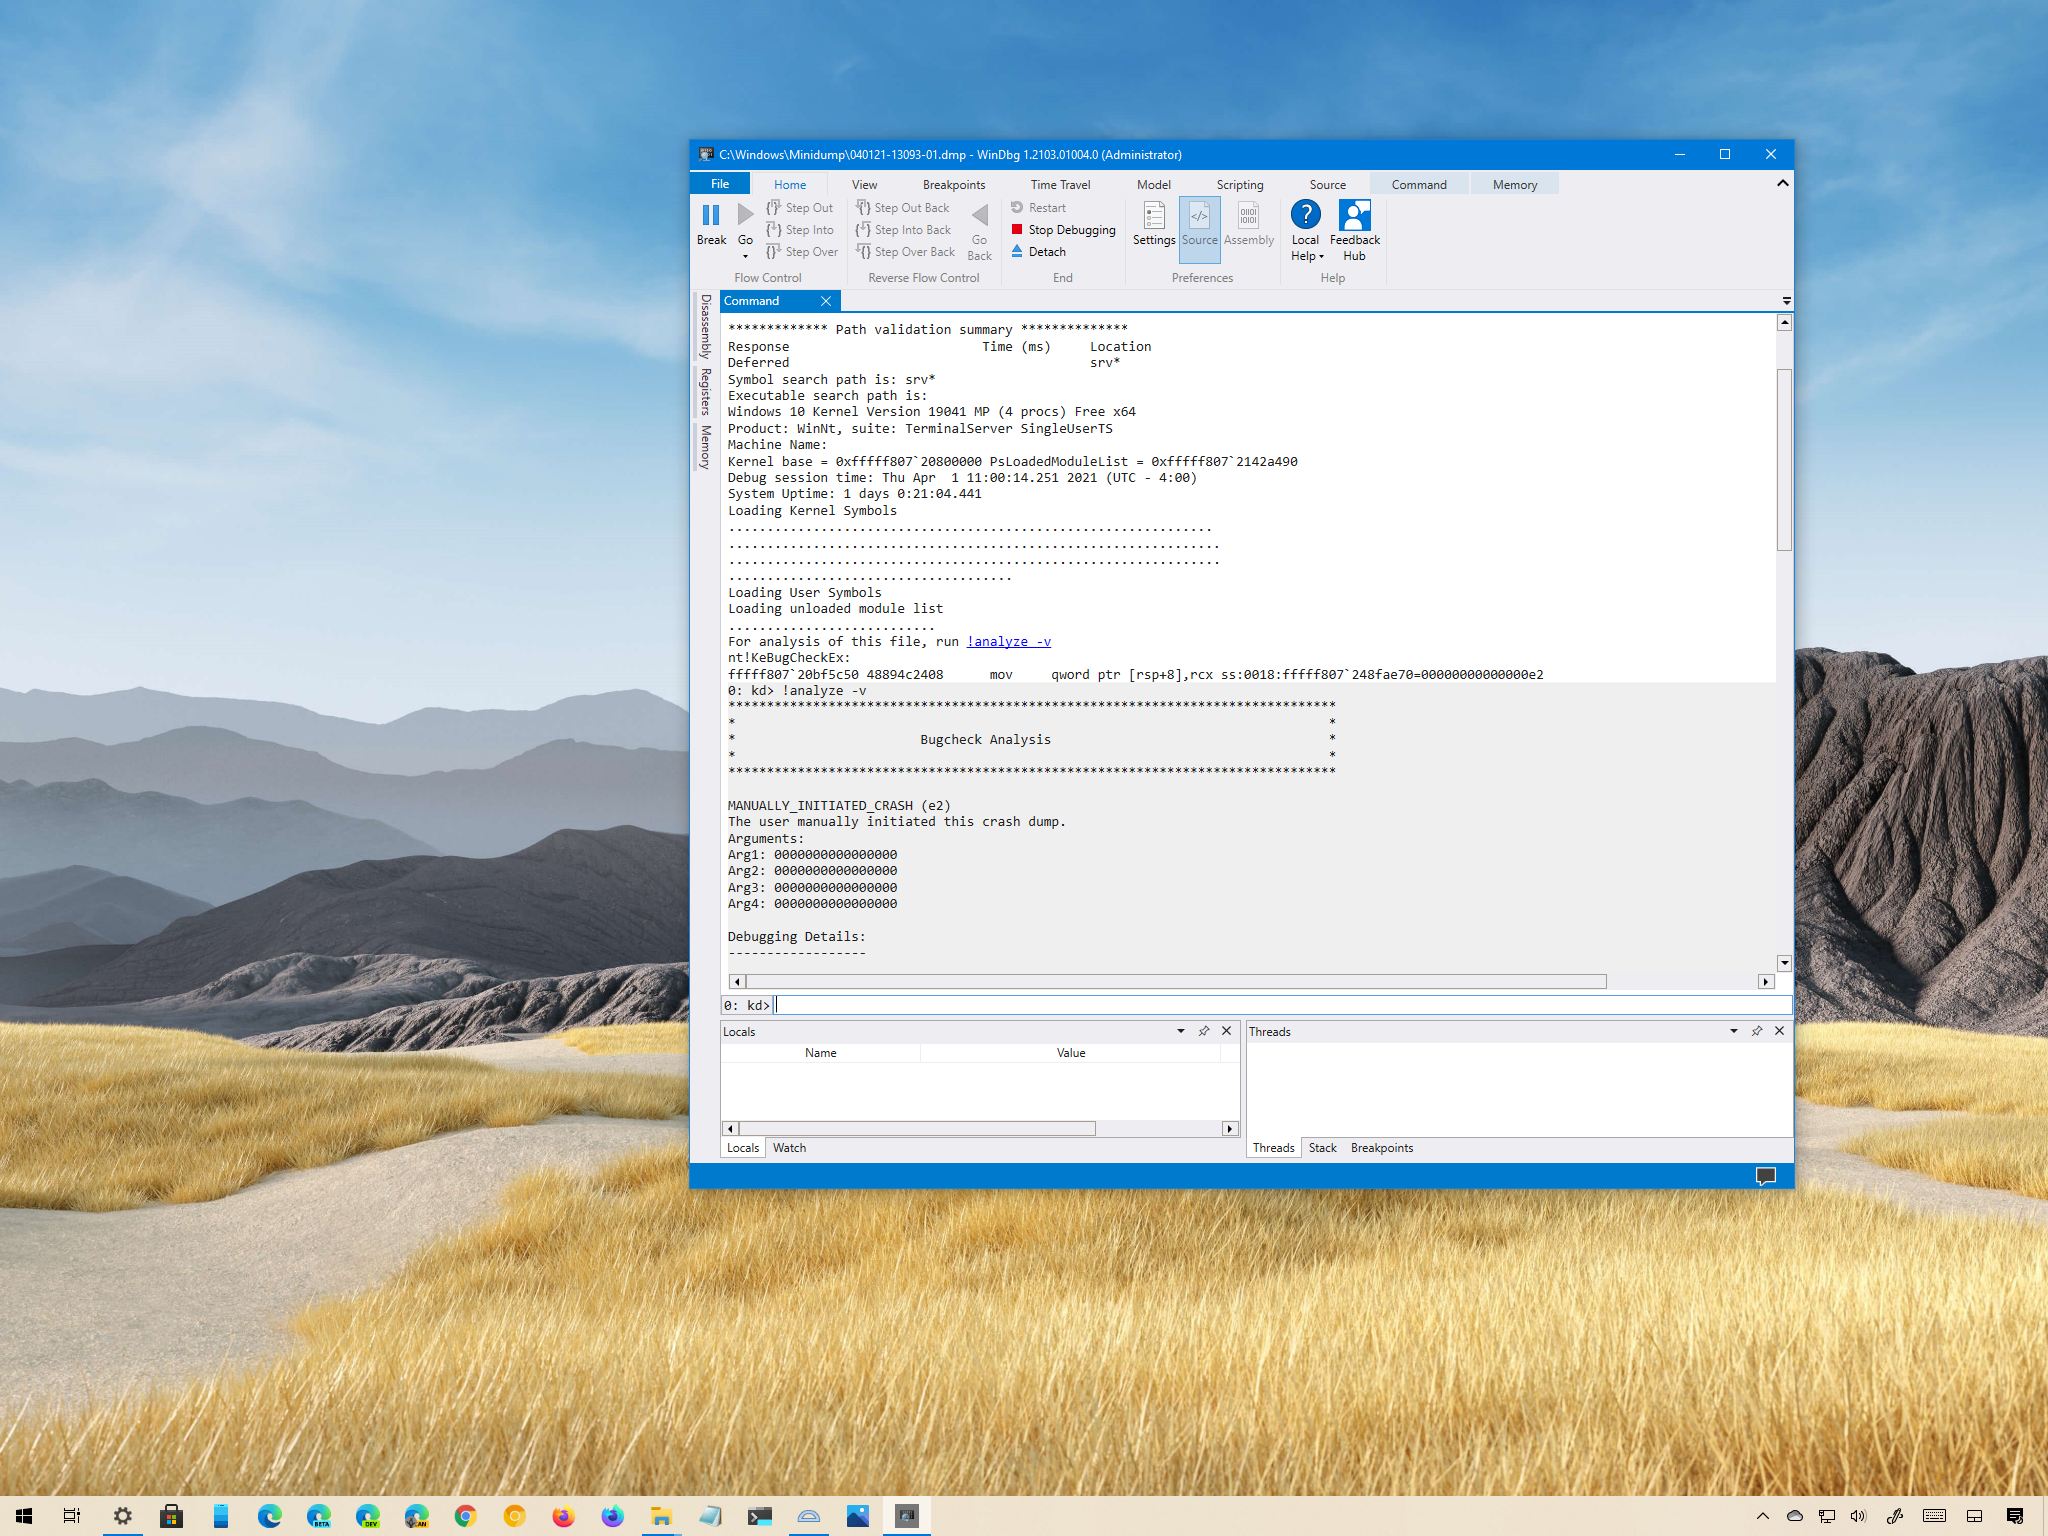
After you complete the steps, the application will return the dump file analyses, which you can then review to determine the reason for the problem to help you resolve the issue.
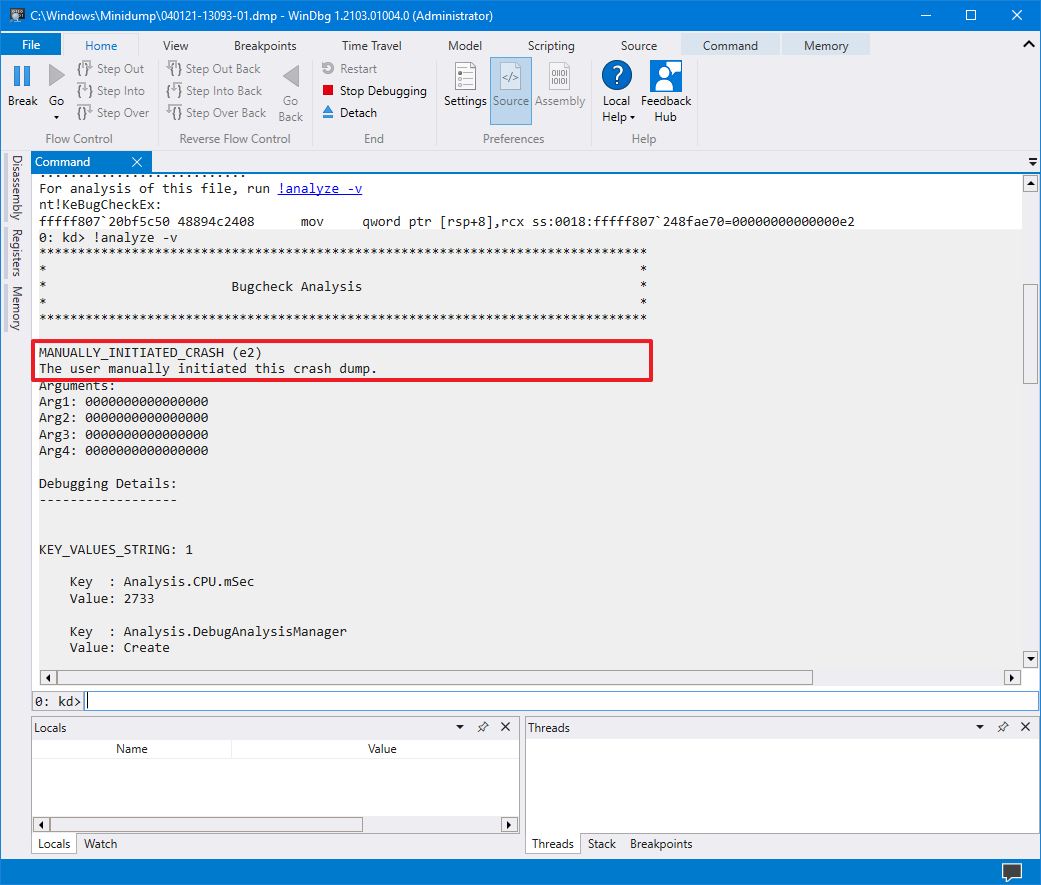
The information will be different depending on the problem. For example, this test dump file shows the info of a Blue Screen of Death (BSoD) – also known as a bug check –.
The result points out that this was a manually initiated crash with an "e2" error code, which is correct since, for the purpose of this guide, we use these instructions to force a BSoD. The WinDbg even makes an excellent job describing the crash in a language anyone can understand (The user manually initiated this crash dump).
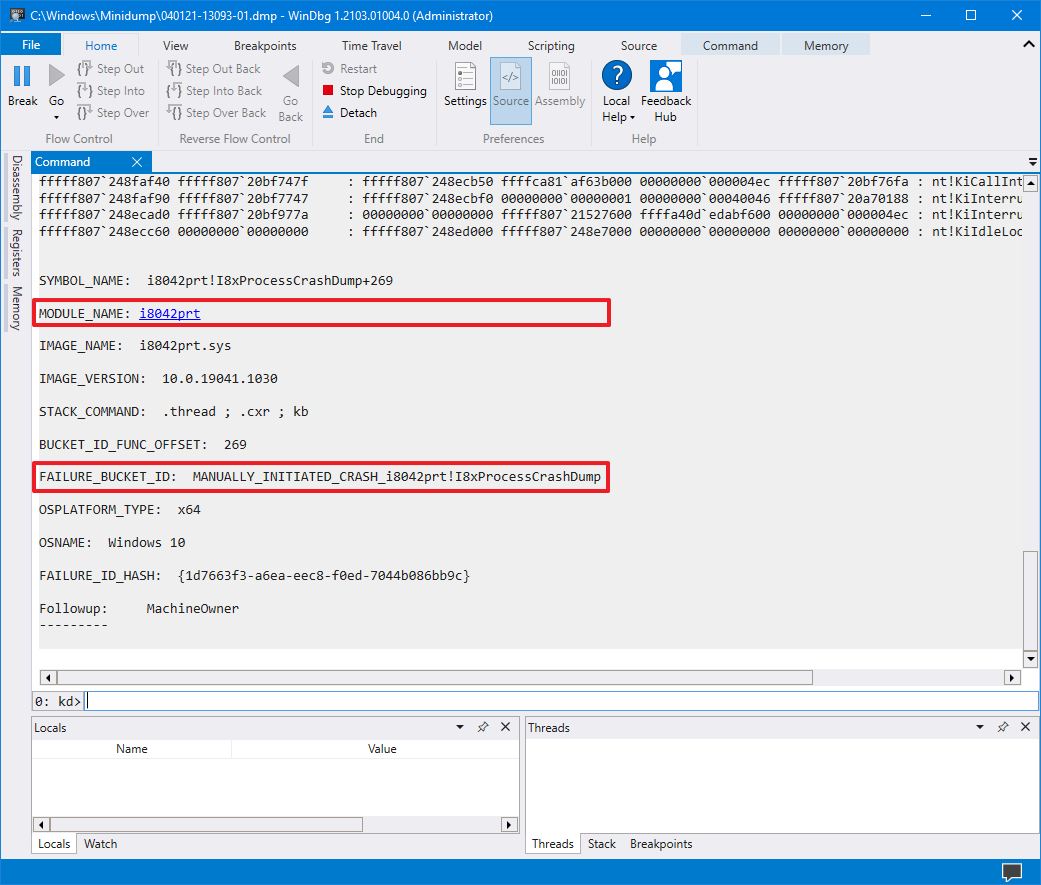
As you continue reviewing the dump file, you will also find more information, such as "FAILURE_BUCKET_ID" and "MODULE_NAME," which could indicate what is causing the problem.
The information can be overwhelming since it is not meant for regular users. If your computer keeps crashing, you can use this tool to get an idea of the problem. If you cannot figure it out, you can use the hints in the report to search online to find more information.
Also, if you feel comfortable, you can share these details at the Window Central or Microsoft forums to allow other people to help you find out a solution.
More Windows 10 resources
For more helpful articles, coverage, and answers to common questions about Windows 10, visit the following resources:



0 comments:
Post a Comment